Chapter 1 Overview
This book starts with a rationale for integrating JavaScript with R and supports it with examples, namely packages that use JavaScript and are available on CRAN. Then, we list the various ways in which one might go about making both languages work together. In the next chapter, we go over prerequisites and a review of concepts fundamental to fully understand the more advanced topics residing in the forthcoming chapters.
1.1 Rationale
Why blend two languages seemingly so far removed from each other? Well, precisely because they are fundamentally different languages that each have their strengths and weaknesses; combining the two allows making the most of their consolidated advantages and circumvents their respective limitations to produce software altogether better for it.
Nevertheless, a fair reason to use JavaScript might be that the thing one wants to achieve in R has already been realised in JavaScript. Why reinvent the wheel when the solution already exists and that it can be made accessible from R? The R package rmapshaper (Teucher and Russell 2020) by Andy Teucher that integrates mapshaper, a library to edit geo-spatial-related files such as GeoJSON, or TopoJSON. JavaScript is by no means required to make those computations; they could be rewritten solely in R, but that would be vastly more laborious than wrapping the JavaScript API in R as done by the package rmapshaper.
library(rmapshaper)

# get data
data(states, package = "geojsonio")

states_json <- geojsonio::geojson_json(
  states,
  geometry = "polygon",
  group = "group"
)
#> Registered S3 method overwritten by 'geojsonsf':
#>   method        from
#>   print.geojson geojson
#> Assuming 'long' and 'lat' are longitude and latitude, respectively

states_sp <- geojsonio::geojson_sp(states_json)

# print shape file size
print(object.size(states_sp), units = "Mb")
#> 0.4 Mb

# simplify with rmapshaper
states_sm <- rmapshaper::ms_simplify(states_sp, keep = 0.05)

# print reduced size
print(object.size(states_sm), units = "Mb")
#> 0.2 Mb
Another great reason is that JavaScript can do things that R cannot, e.g., run in the browser. Therefore, one cannot natively create interactive visualisations with R. Plotly (Sievert et al. 2021) by Carson Sievert packages the plotly JavaScript library to let one create interactive visualisations solely from R code as shown in Figure 1.1.
FIGURE 1.1: Basic htmlwidget example
Finally, JavaScript can work together with R to improve how we communicate insights. One of the many ways in which Shiny stands out is that it lets one create web applications solely from R code with no knowledge of HTML, CSS, or JavaScript, but that does not mean they can’t extend Shiny—quite the contrary. The waiter package (Coene 2021b) integrates a variety of JavaScript libraries to display loading screens in Shiny applications as in Figure 1.2.
library(shiny)
library(waiter)

ui <- fluidPage(
  use_waiter(), # include dependencies
  actionButton("show", "Show loading for 3 seconds")
)

server <- function(input, output, session){
  # create a waiter
  w <- Waiter$new()

  # on button click
  observeEvent(input$show, {
    w$show()
    Sys.sleep(3)
    w$hide()
  })
}

shinyApp(ui, server)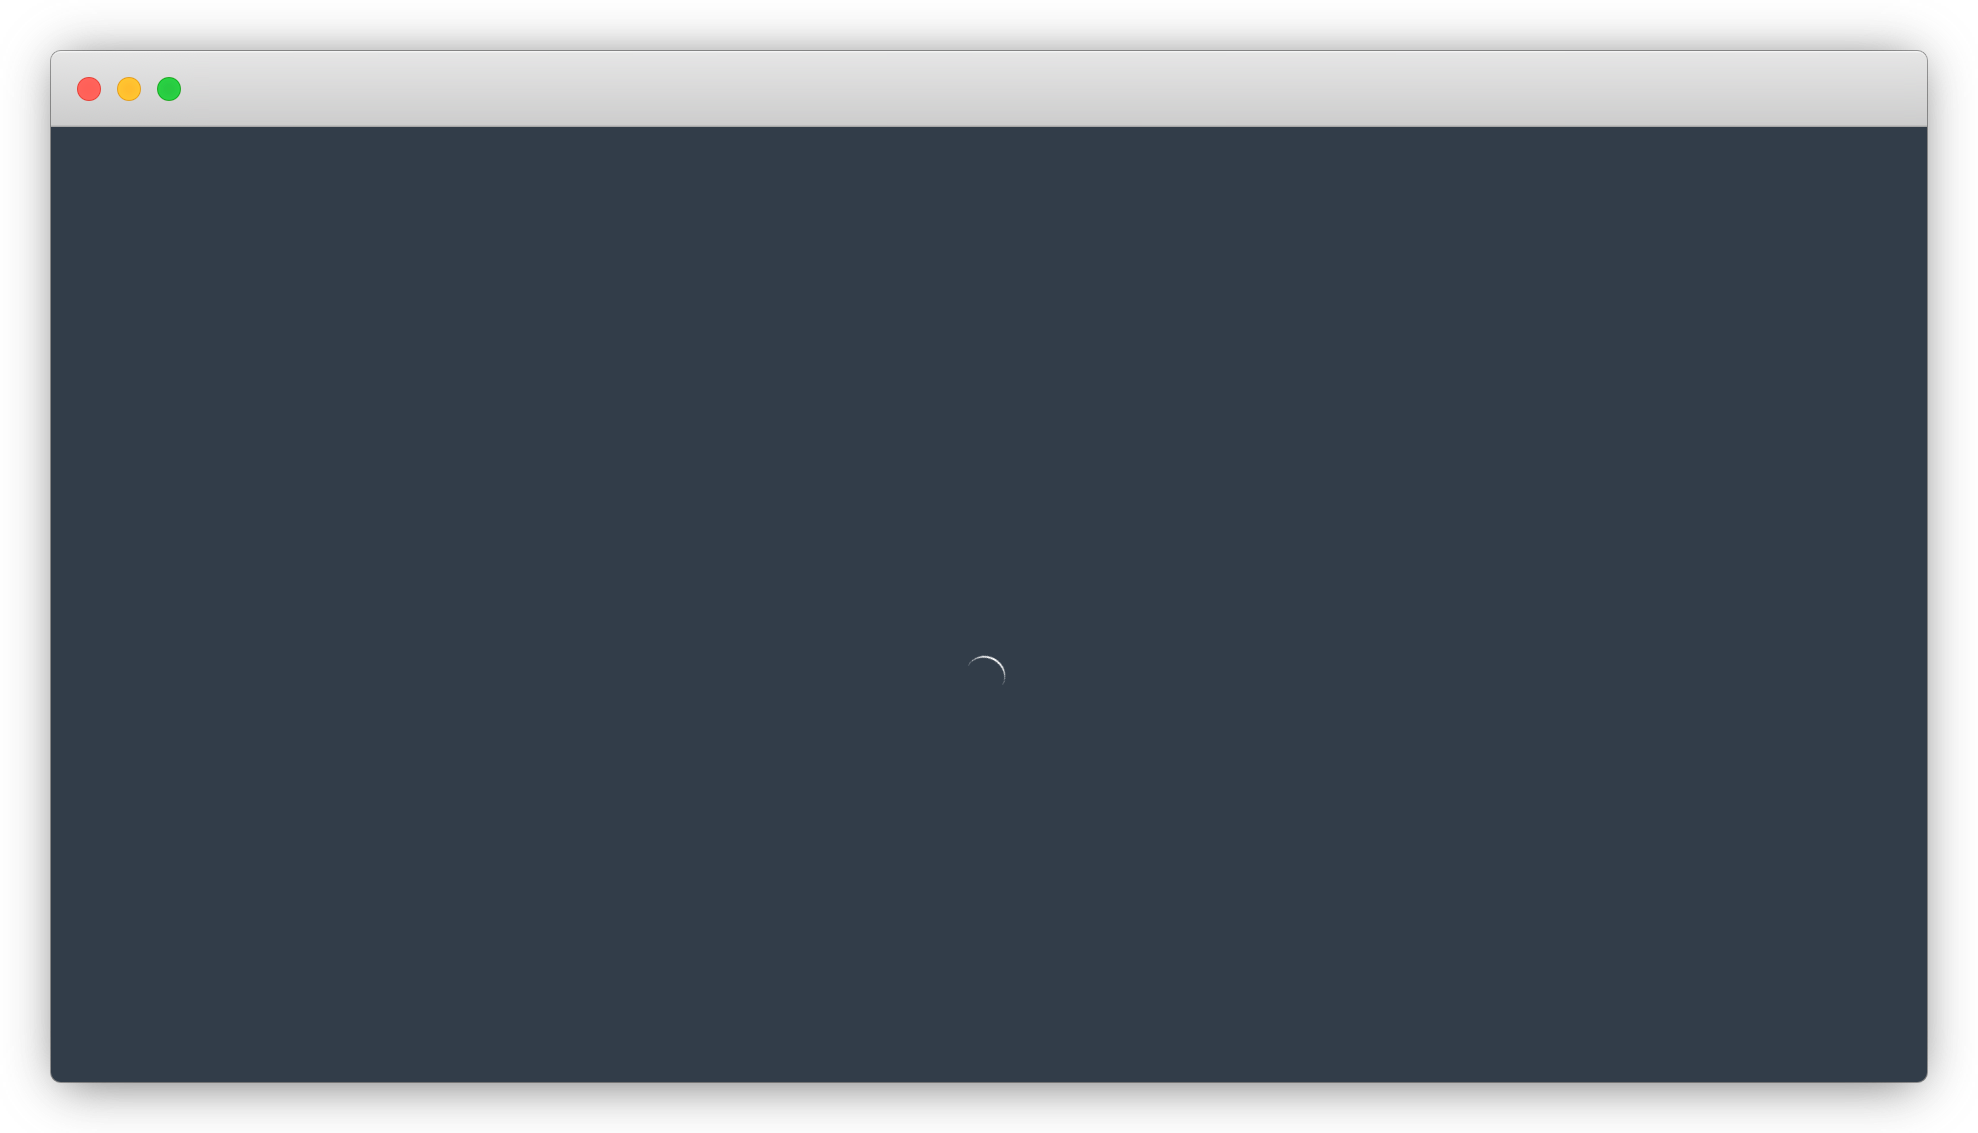
FIGURE 1.2: Waiter screen
Hopefully this makes a couple of great reasons and alluring examples to entice the reader to persevere with this book.
1.2 Methods
Though perhaps not evident at first, all of the packages used as examples in the previous section interfaced with R very differently. As we’ll discover, there are many ways in which one can blend JavaScript with R. Generally the way to go about it is dictated by the nature of what is to be achieved.
Let’s list the methods available to us to blend JavaScript with R before covering each of them in-depth in their own respective chapter later in the book.
1.2.1 V8
V8 by Jeroen Ooms is an R interface to Google’s JavaScript engine. It will let you run JavaScript code directly from R and get the result back; it even comes with an interactive console. This is the way the rmapshaper package used in a previous example internally interfaces with the turf.js library.
1.2.2 htmlwidgets
htmlwidgets (Vaidyanathan et al. 2020) specialises in wrapping JavaScript libraries that generate visual outputs. This is what packages such as plotly, DT (Xie, Cheng, and Tan 2020), highcharter (Kunst 2020), and many more use to provide interactive visualisation with R.
It is by far the most popular integration out there: at the time of writing it has been downloaded nearly 10 million times from CRAN. It will therefore be covered extensively in later chapters.
1.2.3 Shiny
The Shiny framework allows creating applications accessible from web browsers where JavaScript natively runs; it follows that JavaScript can run alongside such applications. Often overlooked though, the two can also work hand-in-hand as one can pass data from the R server to the JavaScript front end and vice versa. This is how the previously-mentioned package waiter internally works with R.
1.3 Methods Amiss
Note that there are also two other prominent ways one can use JavaScript with R that are not covered in this book. The main reason being that they require significant knowledge of specific JavaScript libraries, d3.js and React, and while these are themselves advanced uses of JavaScript, their integration with R via the following listed packages are relatively straightforward.
1.3.1 reactR & vueR
ReactR (Inc et al. 2020) is an R package that emulates very well htmlwidgets but specifically for the React framework. Unlike htmlwidgets, it is not limited to visual outputs and also provides functions to build inputs, e.g., a drop-down menu (like shiny::selectInput). The reactable package (Lin 2020) uses reactR to enable building interactive tables solely from R code as shown in Figure 1.3.
FIGURE 1.3: reactable package example
There is also the package vueR (You and Russell 2020), which brings some of Vue to R.
1.3.2 r2d3
r2d3 (Strayer, Luraschi, and Allaire 2020) by RStudio is an R package designed specifically to work with d3.js. It is similar to htmlwidgets but works rather differently, it allows create visualisations such as Figure 1.4.
# https://rstudio.github.io/r2d3/articles/gallery/chord/
r2d3::r2d3(
  data = matrix(round(runif(16, 1, 10000)), ncol = 4, nrow = 4),
  script = "chord.js"
)
FIGURE 1.4: r2d3 basic example
References
Coene, John. 2021b. Waiter: Loading Screen for ’Shiny’.
Inc, Facebook, Michel Weststrate, Kent Russell, and Alan Dipert. 2020. ReactR: React Helpers. https://github.com/react-R/reactR.
Kunst, Joshua. 2020. Highcharter: A Wrapper for the ’Highcharts’ Library. https://CRAN.R-project.org/package=highcharter.
Lin, Greg. 2020. Reactable: Interactive Data Tables Based on ’React Table’. https://CRAN.R-project.org/package=reactable.
Sievert, Carson, Chris Parmer, Toby Hocking, Scott Chamberlain, Karthik Ram, Marianne Corvellec, and Pedro Despouy. 2021. Plotly: Create Interactive Web Graphics via ’Plotly.js’. https://CRAN.R-project.org/package=plotly.
Strayer, Nick, Javier Luraschi, and JJ Allaire. 2020. R2d3: Interface to ’D3’ Visualizations. https://CRAN.R-project.org/package=r2d3.
Teucher, Andy, and Kenton Russell. 2020. Rmapshaper: Client for ’Mapshaper’ for ’Geospatial’ Operations. https://CRAN.R-project.org/package=rmapshaper.
Vaidyanathan, Ramnath, Yihui Xie, JJ Allaire, Joe Cheng, Carson Sievert, and Kenton Russell. 2020. Htmlwidgets: HTML Widgets for R. https://CRAN.R-project.org/package=htmlwidgets.
Xie, Yihui, Joe Cheng, and Xianying Tan. 2020. DT: A Wrapper of the Javascript Library ’Datatables’. https://CRAN.R-project.org/package=DT.
You, Evan, and Kent Russell. 2020. VueR: ’Vuejs’ Helpers and ’Htmlwidget’. https://github.com/vue-r/vueR.