Chapter 6 A Realistic Widget
In this section, we build a package called peity, which wraps the JavaScript library of the same name, peity.js, to create inline charts. This builds upon many things we explored in the playground package built in the previous chapter.
As done with candidate libraries, as explained in an earlier chapter, there is no avoiding going through the documentation of the library one wants to use to observe how it works. Forging a basic understanding of the library, we can build the following basic example.
<!DOCTYPE html>
<html xmlns="http://www.w3.org/1999/xhtml" lang="" xml:lang="">

<head>
  <!-- Import libraries -->
  <script src="jquery-3.5.1.min.js"></script>
  <script src="jquery.peity.min.js"></script>
</head>

<body>
  <!-- div to hold visualisation -->
  <span id="bar">5,3,9,6,5,9,7,3,5,2</span>

  <!-- Script to create visualisation -->
  <script>
    $("#bar").peity("bar");
  </script>
</body>

</html>
Peity.js depends on jQuery. Hence the latter is imported first; the data for the chart is placed in a <span>, and the peity method is then used on the element containing the data. Peity.js uses <span> HTML tags as these work inline, using a <div> the chart will still display, but the purpose of using peity.js would be defeated.
6.1 Dependencies
Once the package is created and the widget scaffold laid down, we need to add the JavaScript dependencies without which nothing can move forward.
Two dependencies are required in order for peity.js to run: peity.js and jQuery. Instead of using the CDN those are downloaded as this ultimately makes the package more robust (more easily reproducible outputs and no requirement for internet connection). Each of the two libraries is placed in its own respective directory.
dir.create("./inst/htmlwidgets/jquery")
dir.create("./inst/htmlwidgets/peity")

peity <- paste0(
  "https://raw.githubusercontent.com/benpickles/",
  "peity/master/jquery.peity.min.js"
)
jquery <- paste0(
  "https://code.jquery.com/jquery-3.5.1.min.js"
)

download.file(
  jquery, "./inst/htmlwidgets/jquery/jquery.min.js"
)
download.file(
  peity, "./inst/htmlwidgets/peity/jquery.peity.min.js"
)
This produces a directory that looks like this:
.
├── DESCRIPTION
├── NAMESPACE
├── R
│   └── peity.R
└── inst
    └── htmlwidgets
        ├── jquery
        │   └── jquery.min.js
        ├── peity.js
        ├── peity.yaml
        └── peity
            └── jquery.peity.min.js
In htmlwidgets, dependencies are specified in the .yaml file located at inst/htmlwidgets, which at first contains a commented template.
# (uncomment to add a dependency)
# dependencies:
#  - name:
#    version:
#    src:
#    script:
#    stylesheet:
Let’s uncomment those lines as instructed at the top of the file and fill it in.
dependencies:
  - name: jQuery
    version: 3.5.1
    src: htmlwidgets/jquery
    script: jquery.min.js
  - name: peity
    version: 3.3.0
    src: htmlwidgets/peity
    script: jquery.peity.min.js
The order of the dependencies matters. Peity.js depends on jQuery hence the latter comes first in the .yaml.
The order in which one specifies the dependencies matters, just like it does in an HTML file, therefore jQuery is listed first. The stylesheet entries were removed as none of these libraries require CSS files. The src path points to the directory containing the JavaScript files and stylesheets relative to the inst directory of the package; this is akin to using the system.file function to return the full path to a file or directory within the package.
devtools::load_all()
system.file("htmlwidgets/peity", package = "peity")
#> "/home/me/packages/peity/inst/htmlwidgets/peity"
We should verify that this is correct by using the one R function the package features and check the source code of the output to verify that the dependencies are well present in the HTML output. We thus run peity("test"), open the output in the browser ( ) and look at the source code of the page. At the top of the page, you should see
 jquery.min.js and jquery.peity.min.js imported, clicking those links will either present you with the content of the file or an error.
<!DOCTYPE html>
<html>
<head>
<meta charset="utf-8"/>
<style>body{background-color:white;}</style>
<script src="lib/htmlwidgets-1.5.1/htmlwidgets.js"></script>
<script src="lib/jQuery-3.5.1/jquery.min.js"></script>
<script src="lib/peity-3.3.0/jquery.peity.min.js"></script>
<script src="lib/peity-binding-0.0.0.9000/peity.js"></script>
...
6.2 Implementation
The JavaScript code for peity.js is relatively uncomplicated. It is just one function, but integrating it with htmlwidgets requires some thinking. In the example below, peity is applied to the element with id = 'elementId'; the first argument of peity is the type of chart to produce from the data, and the second optional argument is a JSON of options.
Also, the data that peity uses to draw the inline chart is not passed to the function but taken from the HTML element.
Therefore, the htmlwidget will have to insert the data in the HTML element, then run the peity function to render the chart. Inserting the data is actually already done by htmlwidgets by default. Indeed the default htmlwidgets template takes a message from the R function, and inserts said message in the HTML element, passing a vector instead of a message produces precisely what peity expects!
<div
id="htmlwidget-495cf47d1a2a4a56c851"
style="width:960px;height:500px;"
class="play html-widget">
1,5,6,2
</div>The argument ought to be renamed nonetheless from message to data.
peity <- function(data, width = NULL, height = NULL,
elementId = NULL) {
# forward options using x
x = list(
data = data
)
# create widget
htmlwidgets::createWidget(
name = 'peity',
x,
width = width,
height = height,
package = 'peity',
elementId = elementId
)
}The change in the R code must be mirrored in the peity.js file, where it should set the innerText to x.data instead of x.message.
This leaves the implementation of peity.js to turn the data into an actual chart. The way we shall go about it is to paste one of the examples in the renderValue function.
renderValue: function(x) {
// insert data
el.innerText = x.data;
// run peity
$("#elementId").peity("bar", {
  fill: ["red", "green", "blue"]
})
}One could be tempted to run devtools::load_all, but this will not work, namely because the function uses a selector that will not return any object; it needs to be applied to the div created by the widget not #elementId. As explained in the previous chapter, the selector of the element created is accessible from the el object. As a matter of fact, we did log in the browser console the id of the created div taken from el.id. Therefore concatenating the pound sign and the element id produces the selector to said element (.class, #id).
This will work but can be further simplified; there is no need to recreate a selector using the id of the el element; the latter can be used in the jQuery selector directly.
This will now produce a working widget, albeit limited to creating charts of a predefined type and colour. Next, these options defining the chart type, fill colours, and others must be made available from R.
Below we add a type argument to the peity function; this type argument is then forwarded to x, so it is serialised and accessible in the JavaScript file.
peity <- function(data, type = c("bar", "line", "pie", "donut"),
  width = NULL, height = NULL, elementId = NULL) {

  type <- match.arg(type)

  # forward options using x
  x = list(
    data = data,
    type = type
  )

  # create widget
  htmlwidgets::createWidget(
    name = 'peity',
    x,
    width = width,
    height = height,
    package = 'peity',
    elementId = elementId
  )
}
This should then be applied by replacing the hard-coded type ("bar") to x.type.
Reloading the package will now let one create a chart and define its type, but some options remain hard-coded. These can be made available from R in a variety of ways depending on the interface one wants to provide users of the package. Here we make them available via the three-dot construct (...), which are captured in a list and forwarded to the x object.
peity <- function(data, type = c("bar", "line", "pie", "donut"),
  ..., width = NULL, height = NULL, elementId = NULL) {

  type <- match.arg(type)

  # forward options using x
  x = list(
    data = data,
    type = type,
    options = list(...)
  )

  # create widget
  htmlwidgets::createWidget(
    name = 'peity',
    x,
    width = width,
    height = height,
    package = 'peity',
    elementId = elementId
  )
}
These can then be easily accessed from JavaScript.
This makes (nearly) all of the functionalities of peity.js available from R. Below we use htmltools::browsable to create multiple widgets at once, the function only accepts a single value, so the charts are wrapped in an htmltools::tagList. Let us explain those in reverse order, tagList accepts a group of tags or valid HTML outputs like htmlwidgets and wraps them into one, it is necessary here because the function browsable only accepts one value. Typically htmltools tags are just printed in the console; here we need them to be opened in the browser instead. Remember to run devtools::load_all so you can run the peity function we just wrote.
library(htmltools)

browsable(
  tagList(
    peity(runif(5)),
    peity(runif(5), type = "line"),
    peity("1/4", type = "pie", fill = c("#c6d9fd", "#4d89f9")),
    peity(c(3,5), type = "donut")
  )
)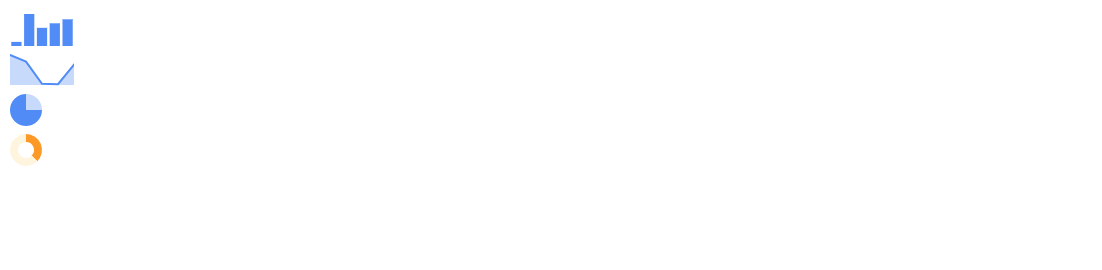
FIGURE 6.1: Peity output with DIV
There is nonetheless one remaining issue in Figure 6.1: peity.js is meant to create inline charts within <span> HTML tags but these are created within <div> hence each chart appears on a new line.
6.3 HTML Element
As pointed out multiple times, the widget is generated in a <div>, which is working fine for most visualisation libraries. However, we saw that peity.js works best when placed in a <span> as this allows placing the charts inline.
This can be changed by placing a function named widgetname_html, which is looked up by htmlwidgets and used if found. This is probably the first such function one encounters and is relatively uncommon, but it is literally how the htmlwidgets package does it: it scans the namespace of the package looking for a function that starts with the name of the widget and ends in _html and if found uses it. Otherwise, it uses the default div. This function takes the three-dot construct (...) and uses them in an htmltools tag. The three-dots are necessary because internally htmlwidgets need to be able to pass the id, class, and style attributes to the tag.
This can also come in handy if some arguments must be hard-coded, such as assigning a specific class to every widget.
Reloading the package after placing the function above anywhere in the package will produce inline charts, as show in Figure 6.2.
browsable(
  tagList(
    p(
      "We can now", peity(runif(5)),
      "use peity", peity(runif(5), type = "line"),
      "inline with text!",
      peity(c(4,2), type = "donut")
    )
  )
)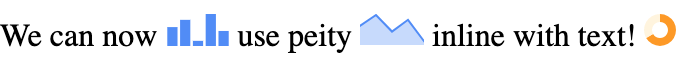
FIGURE 6.2: Peity output with SPAN