Chapter 17 Widgets with Shiny
We have seen how to make JavaScript and R communicate in Shiny applications by passing data from the server to the client and back. This chapter explores how to apply that to htmlwidgets so they can provide additional functionalities when used in Shiny applications.
To demonstrate how to integrate these functionalities in widgets, we shall implement them in the previously built gio package.
17.1 Widgets to R
In a previous chapter on Linking Widgets, the topic of callback function was briefly explored. Gio.js provides a callback function that is fired every time a country is selected on globe; this is currently used to share said country with other widgets as part of the implementation with crosstalk. This callback function could also send data back to the R server where they could be used for many things like fetching more data on the selected country from a database or use that information to generate a Shiny UI element like displaying the flag of the selected country, and much, much more.
The callback function in the gio package currently looks like this; it only makes use of some of the data for crosstalk.
// define callback function
function callback (selectedCountry, relatedCountries) {
  sel_handle.set([selectedCountry.ISOCode]);
}

// use callback function
controller.onCountryPicked(callback);
We can make further use of this to define two different Shiny inputs; one for the selected country and another for its related edges.
// gio.js
// define callback function
function callback (selectedCountry, relatedCountries) {
  sel_handle.set([selectedCountry.ISOCode]);
  Shiny.setInputValue('selected', selectedCountry);
  Shiny.setInputValue('related', relatedCountries);
}
However, this will generate an issue experienced in a previous chapter; multiple gio visualisations in a single Shiny application would be defining the values of a single input. This can be remedied to by using the id of the visualisation to generate the input name dynamically.
renderValue: function(x) {

  var controller = new GIO.Controller(el);
  controller.addData(x.data);
  controller.setStyle(x.style);

  // callback
  function callback (selectedCountry, relatedCountries) {
    sel_handle.set([selectedCountry.ISOCode]);
    Shiny.setInputValue(el.id + '_selected', selectedCountry);
    Shiny.setInputValue(el.id + '_related', relatedCountries);
  }

  controller.onCountryPicked(callback);

  // render
  controller.init();

}
The package can then be installed with devtools::install so we can test these inputs in a Shiny application (Figure 17.1).
library(gio)
library(shiny)

# large sample data
url <- paste0(
  "https://raw.githubusercontent.com/JohnCoene/",
  "javascript-for-r/master/data/countries.json"
)
arcs <- jsonlite::fromJSON(url)

ui <- fluidPage(
  gioOutput("globe"),
  fluidRow(
    column(6, verbatimTextOutput("selectedCountry")),
    column(6, verbatimTextOutput("relatedCountries"))
  )
)

server <- function(input, output){

  output$globe <- renderGio({
    gio(arcs, source = i, target = e, value = v)
  })

  output$selectedCountry <- renderPrint({
    print(input$globe_selected)
  })

  output$relatedCountries <- renderPrint({
    print(input$globe_related)
  })

}

shinyApp(ui, server)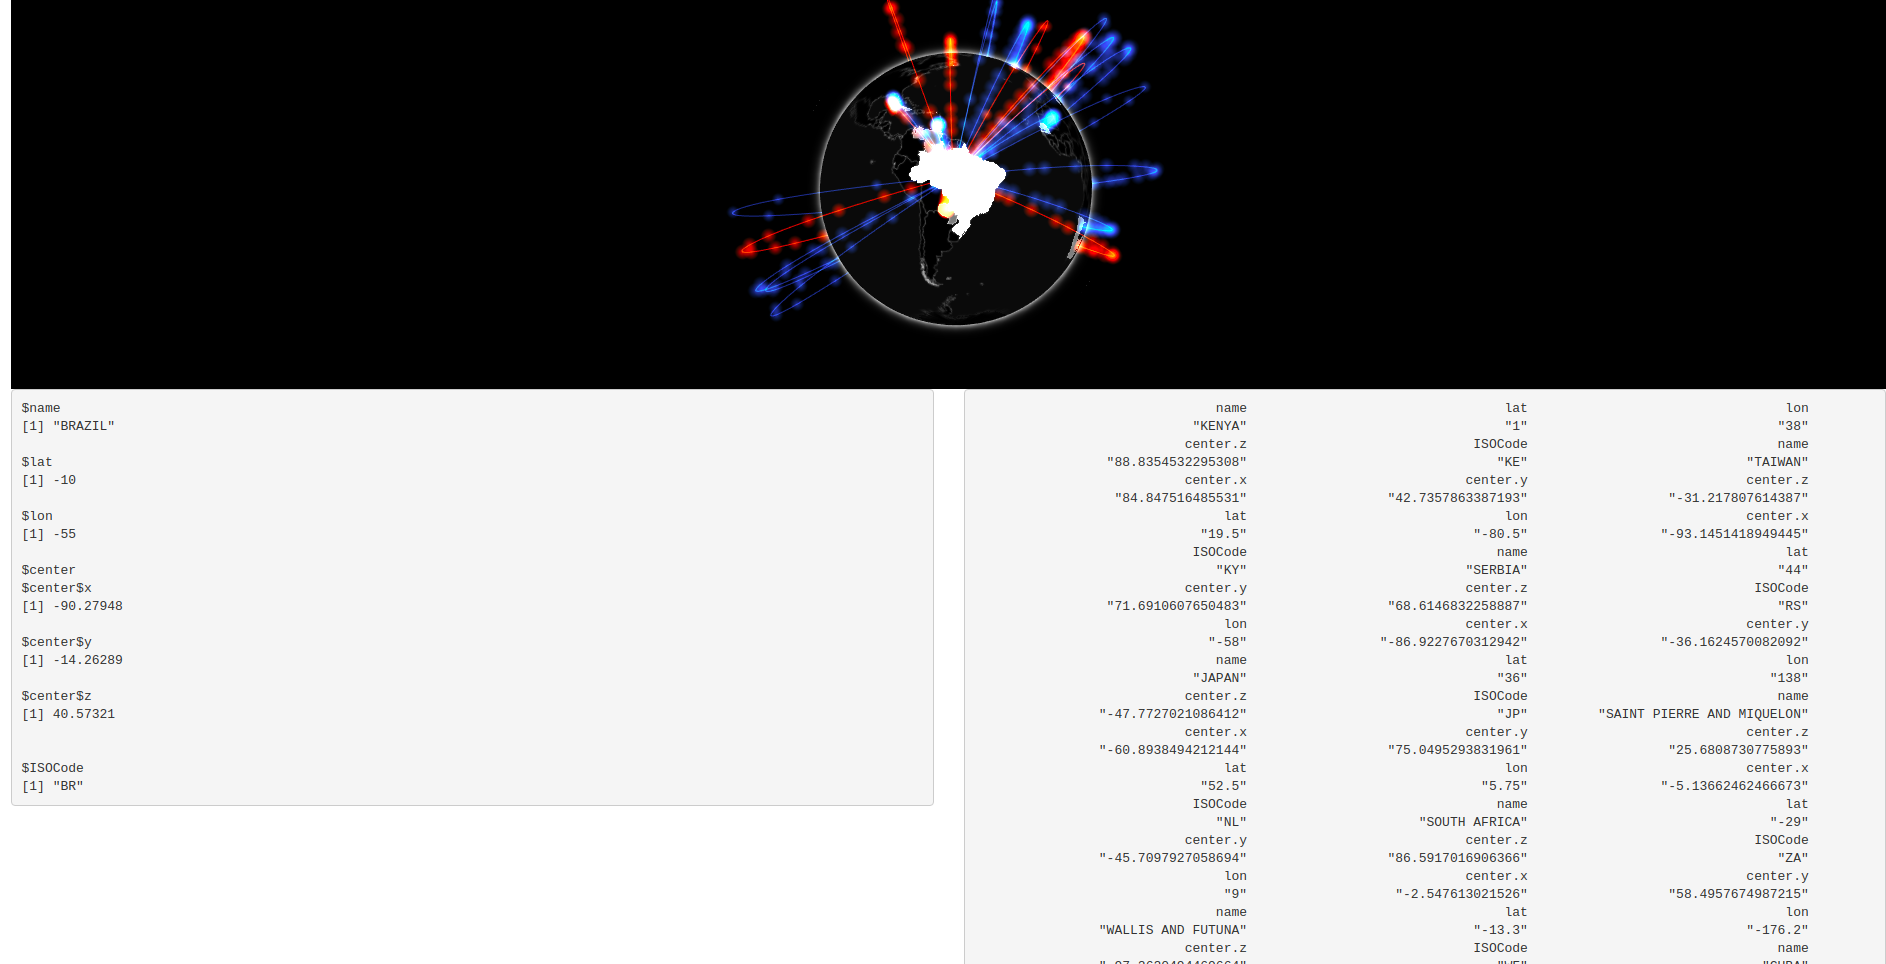
FIGURE 17.1: Gio with input data
One thing to note before moving on, the data is sent from the client to the server whether the inputs are used or not, though this likely will not negatively impact gio it can reduce performances if the callback function is triggered too frequently. For instance, an input value set when the user hovers a scatter plot might lead to the event being fired very frequently and too much data being sent to the server, slowing things down and providing a poor experience.
Therefore one might consider making the capture of such event optional, so the web browser is not strained unless explicitly asked by the developer of the application. This could be implemented with a simple function that sets a simple logical variable in the x object that is used in JavaScript to check whether to implement the callback function.
Then this could be used in JavaScript with an if statement.
One might also consider not sending back all the data. For instance, gio returns the coordinates of the selected country wherefrom arcs connect; this might be considered unnecessary. The code below only sets the input to the ISO code of the country selected.
17.2 Input Handlers for Widgets
Input handlers were explored in an earlier chapter where it was used to transform the results of an image classification model from a list to a data.frame. We can apply something very similar to this input data; the “related countries” returned consist of edges and should be reshaped into a data.frame as well (that looks like gio’s input data).
Below we create a handler that is going to loop over the list (over each arc) and return a data frame.
# handler.R
related_countries_handler <- function(x, session, inputname){
  purrr::map_dfr(x, as.data.frame)
}
Then the handler must be registered with Shiny since handlers can only be registered once an excellent place to put it this is in the .onLoad function of the package.
# zzz.R
related_countries_handler <- function(x, session, inputname){
  purrr::map_dfr(x, as.data.frame)
}

.onLoad <- function(libname, pkgname) {
  shiny::registerInputHandler(
    "gio.related.countries",
    related_countries_handler
  )
}
Finally, we can reinstall the package with devtools::install and create a Shiny application to observe the change. In Figure 17.2 we use a large example dataset and, since the input now returns a data frame, we can display the input value in a table.
library(DT)
library(gio)
library(shiny)

# large sample data
url <- paste0(
  "https://raw.githubusercontent.com/JohnCoene/",
  "javascript-for-r/master/data/countries.json"
)
arcs <- jsonlite::fromJSON(url)

ui <- fluidPage(
  gioOutput("globe"),
  DTOutput("relatedCountries")
)

server <- function(input, output){

  output$globe <- renderGio({
    gio(arcs, i, e, v)
  })

  output$relatedCountries <- renderDT({
    datatable(input$globe_related)
  })

}

shinyApp(ui, server)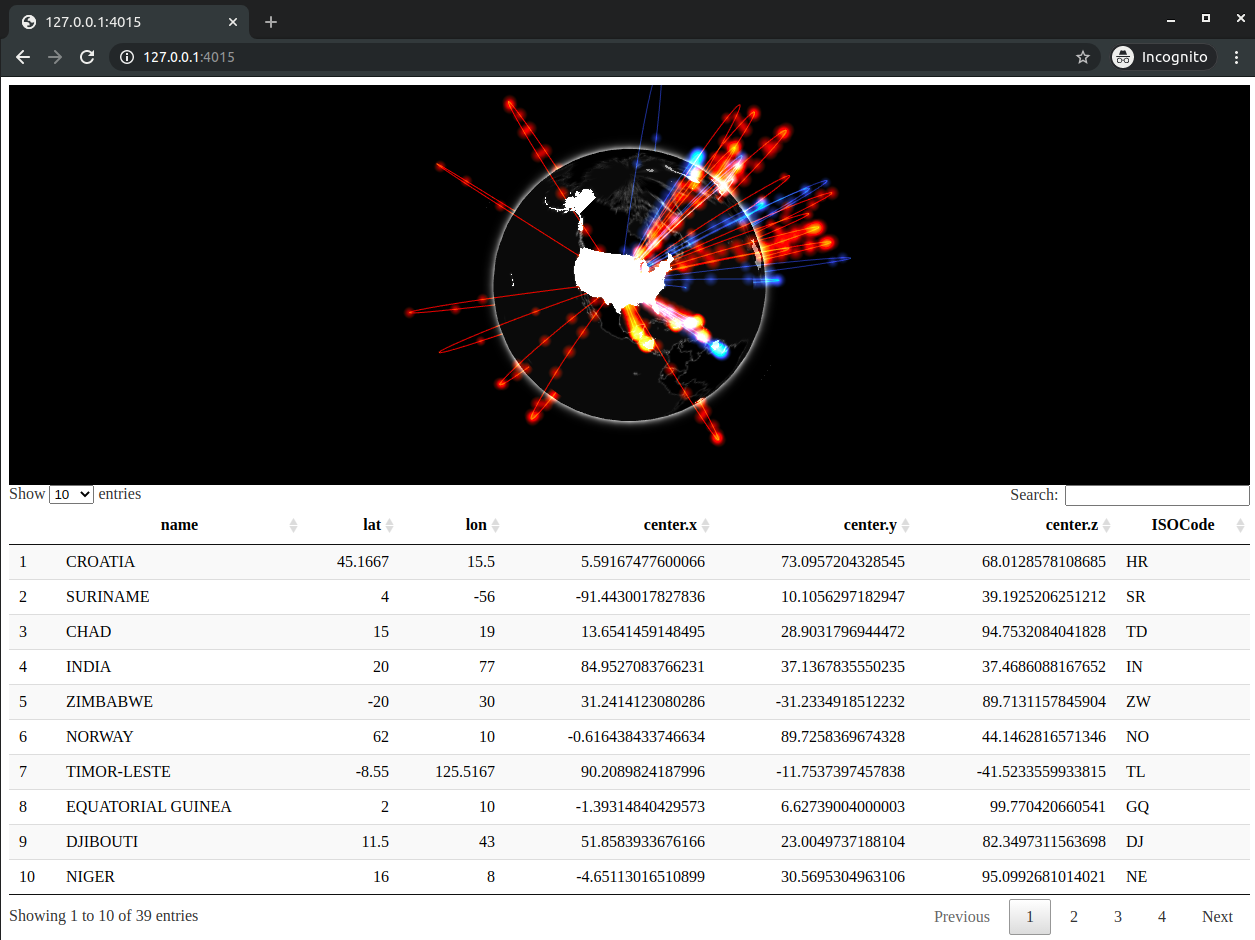
FIGURE 17.2: Gio input data transformed to a data frame
17.3 R to Widgets
This book previously explored how to send data from the Shiny server to the front end; this section applies this to htmlwidgets. Currently, using gio in Shiny consists of generating the globe with the renderGio and complimentary gioOutput functions. This generates the complete visualisation, it creates the HTML element where it places the globe, draws the arcs based on the data, sets the style, etc.
Now imagine that only one of those aspects needs changing, say the data, or the style, given the functions currently at hand one would have to redraw the entire visualisation, only this time changing the data or the style. This is inelegant and not efficient, most JavaScript visualisation libraries, including gio.js, will enable changing only certain aspects of the output without having to redraw it all from scratch.
Before we look into the implementation, let us create a Shiny application which would benefit from such a feature. The Shiny application below (Figure 17.3) provides a drop-down menu to select between two datasets to draw on the globe, running it reveals an issue with gio though. Upon selecting a dataset with the drop down a second globe appears underneath the original one. This is because internally gio.js creates a new element (<canvas>) within the <div> created by htmlwidgets when running init regardless of whether one was already created. Therefore, every call to init creates a new <canvas> with a different globe. Note that most visualisation libraries will not have that issue, they will detect the existing output and override it instead.
library(gio)
library(shiny)

arcs1 <- data.frame(
  e = c("US", "CN", "RU"),
  i = c("CN", "RU", "US"),
  v = c(100, 120, 130)
)

arcs2 <- data.frame(
  e = c("CN", "CN", "JP"),
  i = c("IN", "JP", "US"),
  v = c(100, 120, 130)
)

ui <- fluidPage(
  selectInput(
    "dataset",
    "Select a dataset",
    choices = c("First", "Second")
  ),
  gioOutput("globe")
)

server <- function(input, output){

  reactive_arcs <- reactive({
    if(input$dataset == "First")
      return(arcs1)
    return(arcs2)
  })

  output$globe <- renderGio({
    gio(reactive_arcs(), i, e, v)
  })

}

shinyApp(ui, server)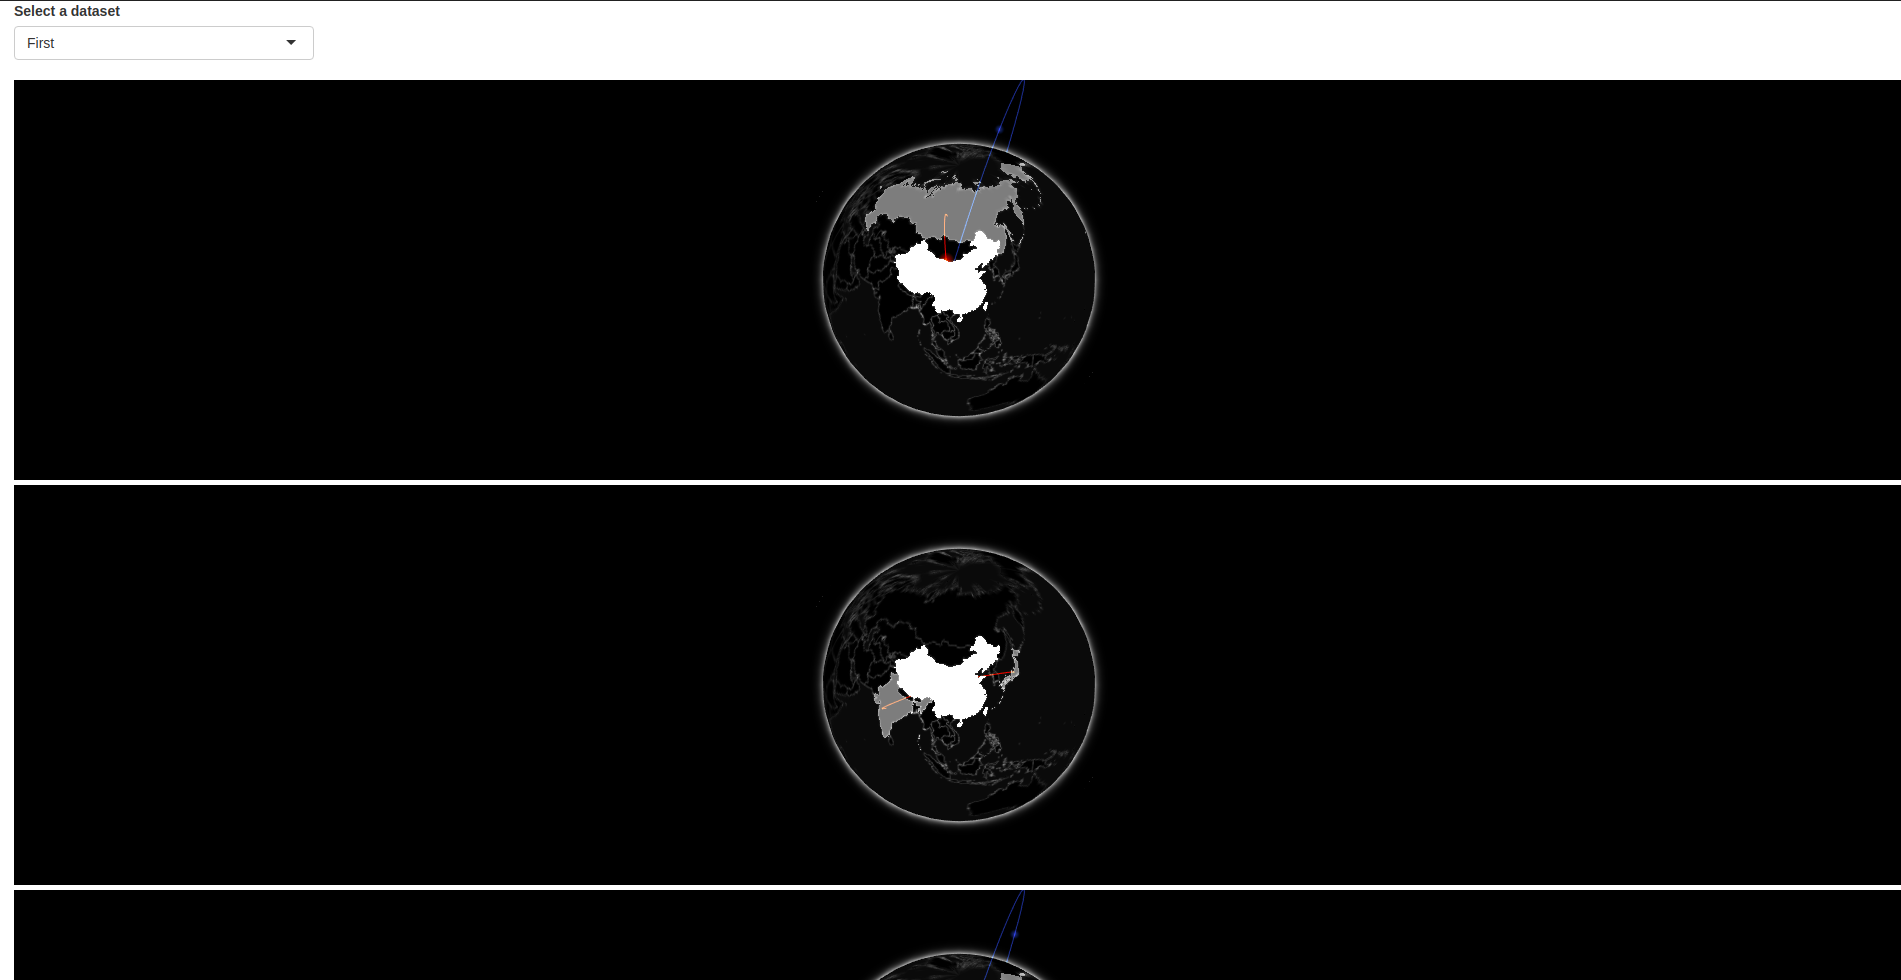
FIGURE 17.3: Gio issue in shiny
A solution to this is to ensure the container (el) is empty before generating the visualisation. Incidentally, this can be executed with a JavaScript method previously used in this book: innerHTML.
Now, using the dropdown to switch between dataset does not generate a new visualisation.
We got sidetracked, but this had to be fixed. Ideally, when the user selects a dataset from the dropdown the entire visualisation is not redrawn, only the underlying data (the arcs) changes. To do so, a new set of functions divorced from the ones currently at hand needs to be created. This separation will allow leaving the already created functions as-is, using gio and its corresponding renderValue JavaScript function to initialise a visualisation, and have a separate family of functions dedicated to working with different JavaScript functions which circumvent renderValue and directly change aspects of the visualisation, such as the underlying dataset.
This involves a few moving parts, thankfully some of them were already explored, just not in the context of htmlwidgets. The scheme is to send data from R to JavaScript using the formerly exploited session$sendCustomMessage, then in JavaScript fetch the instance of the visualisation (controller in the case of gio) to interact with it (e.g. controller.addData(data);).
17.3.1 Send Data from Widgets
Let us start by creating the R function used to send data to JavaScript. This is hopefully reminiscent of a previous chapter; this function sends a message to JavaScript where it is paired with “message handler” that does something with said message. Note that for consistency the function uses the same arguments as the other function of the package which accepts data: gio.
#' @export
gio_send_data <- function(id, data, source, target, value,
  session = shiny::getDefaultReactiveDomain()){

  data <- dplyr::select(
    data,
    i = {{ source }},
    e = {{ target }},
    v = {{ value }}
  )
  message <- list(id = id, data = data)
  session$sendCustomMessage("send-data", message)
}
The function takes the id of the visualisation the data is destined for, the data object itself, and a Shiny session used to send the data. The id of the visualisation is sent as part of the message and will be used to retrieve the instance of the visualisation and subsequently apply the new dataset. Note that we give this message the send-data identifier, this will be needed when we write its handler.
There is one caveat that will make it such that the above will not work. To have gio.js work with data changes had to be made to the serialiser (using the TOJSON_ARGS attribute), this cannot be used here. The data being sent with Shiny via the session object the problem reoccurs: Shiny, like htmlwidgets, serialises data frames column-wise and not row-wise. One can preview the way Shiny serialises with shiny:::toJSON (three-colon).
# preview shiny serialisation
shiny:::toJSON(arcs)
#> {"e":["CN","CN"],"i":["US","RU"],"v":[3300000,10000]}
Unfortunately this serialiser cannot be changed, therefore we have to reformat the data to a list which resembles the JSON output desired, using apply to turn every row into a list will do the job in most cases.
#' @export
gio_send_data <- function(id, data, source, target, value,
  session = shiny::getDefaultReactiveDomain()){

  data <- dplyr::select(
    data,
    i = {{ source }},
    e = {{ target }},
    v = {{ value }}
  )
  message <- list(id = id, data = apply(data, 1, as.list))
  session$sendCustomMessage("send-data", message)
}
17.3.2 Retrieve Widget Instance
We will need to be able to access the instance of the visualisation (controller) outside of the function factory. This can be made accessible by adding a function (technically a method) that returns the controller. Below we create a function called getGlobe which returns the controller.
HTMLWidgets.widget({

  name: 'gio',

  type: 'output',

  factory: function(el, width, height) {

    // TODO: define shared variables for this instance
    var controller;

    // selection handle
    var sel_handle = new crosstalk.SelectionHandle();

    sel_handle.on("change", function(e) {
      if (e.sender !== sel_handle) {
        // clear selection
      }
      controller.switchCountry(e.value[0]);
    });


    return {

      renderValue: function(x) {

        el.innerHTML = '';
        controller = new GIO.Controller(el, x.configs);

        // group
        sel_handle.setGroup(x.crosstalk.group);

        // add data
        controller.addData(x.data);

        controller.setStyle(x.style);

        // callback
        controller.onCountryPicked(callback);

        function callback (selectedCountry, relatedCountries) {
          sel_handle.set([selectedCountry.ISOCode]);
          Shiny.setInputValue(
            el.id + '_selected',
            selectedCountry
          );
          Shiny.setInputValue(
            el.id + '_related:gio.related.countries',
            relatedCountries
          );
        }

        // use stats
        if(x.stats)
          controller.enableStats();

        // render
        controller.init();

      },

      resize: function(width, height) {

        // TODO: code to re-render the widget with a new size
        controller.resizeUpdate()

      },

      getGlobe: function(){
        return controller;
      }

    };
  }
});
Then, anywhere in the gio.js file, we create a function that uses HTMLWidgets.find to retrieve the instance of the htmlwidgets it takes a selector as input. We concatenate the pound sign to select the widget based on its id (#id, .class). This, in effect, returns an object, which includes all the functions returned by the factory function: renderValue, resize, and getGlobe. We can therefore use the getGlobe method available from that object to retrieve the actual controller.
17.3.3 Handle Data
We can now turn our attention to actually applying the data sent from the R server to the visualisation: the “message handler.” Registering the message handler is only relevant if Shiny is running. Therefore htmlwidgets comes with a function to check whether that is the case, which is useful to avoid needless errors. We can thus use it in an if-statement in which all message handlers will be registered.
// gio.js

// check if shiny running
if (HTMLWidgets.shinyMode){

  // send-data message handler
  Shiny.addCustomMessageHandler(
    type = 'send-data', function(message) {

  });

}
What the currently empty send-data message handler should do is fetch the widget using the id sent from R with the get_gio function and then use the addData method to override the previously-defined arcs.
// gio.js

// check if shiny running
if (HTMLWidgets.shinyMode){

  // send-data message handler
  Shiny.addCustomMessageHandler(
    type = 'send-data', function(message) {

    // retrieve controller
    var controller = get_gio(message.id);

    // add data
    controller.addData(message.data);

  });

}
We can then build a Shiny application to test the new functionality.
library(gio)
library(shiny)

# two phoney datasets
arcs1 <- data.frame(
  e = c("US", "CN", "RU"),
  i = c("CN", "RU", "US"),
  v = c(100, 120, 130)
)

arcs2 <- data.frame(
  e = c("CN", "CN", "JP"),
  i = c("IN", "JP", "US"),
  v = c(100, 120, 130)
)

ui <- fluidPage(
  selectInput(
    "dataset",
    "Select a dataset",
    choices = c("First", "Second")
  ),
  gioOutput("globe")
)

server <- function(input, output){

  reactive_arcs <- reactive({
    if(input$dataset == "First")
      return(arcs1)
    return(arcs2)
  })

  output$globe <- renderGio({
    gio(arcs1, i, e, v)
  })

  observeEvent(input$dataset, {
    if(input$dataset == "First")
      data <- arcs1
    else
      data <- arcs2

    gio_send_data("globe", data, i, e, v)
  })

}

shinyApp(ui, server)
Switching dataset with the dropdown only changes the data; it makes for a much smoother animation, even the difference in the speed at which the effect is visible on the visualisation is perceivable.
17.4 Proxy Function
Before we add other similar functions, we ought to pause and consider the API this provides the user. There are two points, every function such as gio_send_data, will need to accept the id and session arguments. It will be tedious to so every time, following the old “don’t repeat yourself” adage we ought to abstract this further.
This can be remedied to by introducing what is often referred to as a “proxy.” A proxy is just a representation of the graph, or pragmatically, an object that contains the id of the visualisation and a Shiny session. This object can subsequently be piped to other functions, thereby providing not only a cleaner but also a more consistent API.
#' @export
gio_proxy <- function(id,
  session = shiny::getDefaultReactiveDomain()
){

  list(id = id, session = session)
}
Above we create a function called gio_proxy; it takes the id of the chart one wants to build a proxy for, as well as the Shiny session, these are returned in the form of a list. Next, we should adapt the gio_send_data so that it accepts the output of gioProxy instead of the id and session as done previously. In order to allow chaining such functions, we also make sure it returns the proxy object.
17.5 Clear Data
In order to actively demonstrate the advantage of the “proxy” function as well as to hammer home how such functions work, we shall build another, which removes all data from the globe. In JavaScript, it’s as simple as controller.clearData();.
The journey starts with the R code, where we create a new function that sends a message to clear the data; the message only needs to contain the id of the visualisation from which data needs to be cleared, as before it will be used to retrieve the controller from which the clearData method is available.
#' @export
gio_clear_data <- function(proxy){
  message <- list(id = proxy$id)
  proxy$session$sendCustomMessage("clear-data", message)
  return(proxy)
}
Now onto the JavaScript code to catch that message and actually clear the data from the globe. That function is very similar to what was previously shown, the only difference is the name of the message handler and the method used on the controller.
// gio.js
Shiny.addCustomMessageHandler(
  type = 'clear-data', function(message) {

    var controller = get_gio(message.id);
    controller.clearData();
});
Then one can build an application to test that new function. We build a Shiny application with a button to add the data to the visualisation and another to clear data from it, as shown in Figure 17.4.
library(gio)
library(shiny)

# phoney dataset
arcs <- data.frame(
  e = c("US", "CN", "RU"),
  i = c("CN", "RU", "US"),
  v = c(100, 120, 130)
)

ui <- fluidPage(
  actionButton("load", "Load data"),
  actionButton("clear", "Clear data"),
  gioOutput("globe")
)

server <- function(input, output){

  output$globe <- renderGio({
    gio(arcs, i, e, v)
  })

  observeEvent(input$load, {
    gio_proxy("globe") %>%
      gio_send_data(arcs, i, e, v)
  })

  observeEvent(input$clear, {
    gio_proxy("globe") %>%
      gio_clear_data()
  })

}

shinyApp(ui, server)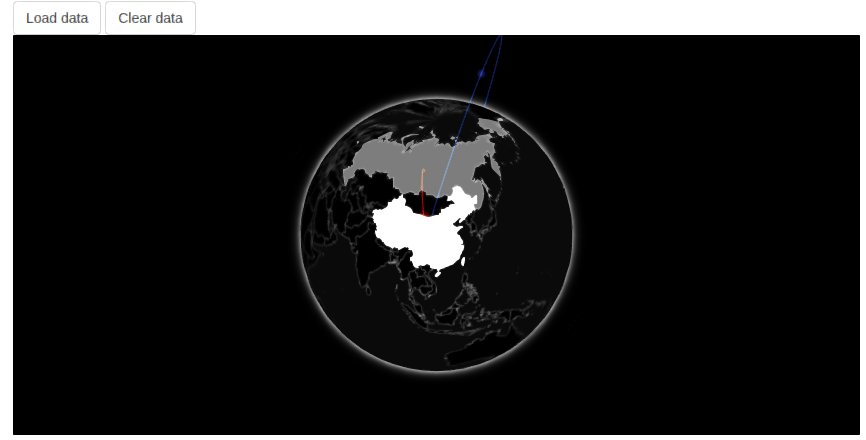
FIGURE 17.4: Gio with clear data proxy
17.6 Update the Widget
The previous proxies defined worked for reasons unbeknownst to the author of this book. It will not work with all methods. The reason it will not work is one that is likely to occur with many other visualisation libraries. For instance, one can attempt to develop a function to dynamically change the style without having to redraw the entire globe, starting again with the R function.
#' @export
gio_set_style <- function(proxy, style){
  message <- list(id = proxy$id, style = style)
  proxy$session$sendCustomMessage("set-style", message)
  return(proxy)
}
Then, adding the JavaScript handler.
Shiny.addCustomMessageHandler(
  type = 'set-style', function(message) {
    var controller = get_gio(message.id);
    controller.setStyle(message.style);
});
At this stage, one can try the function in a Shiny application, but it will not work because most such methods that change underlying aspects of a visualisation will not be reflected in real-time. Gio.js, and many other libraries, will require one to explicitly ask for an update so the changes take effect. This has multiple advantages, one can stack multiple visual changes to execute them at the same time, and one can manage the load on the front end.
Shiny.addCustomMessageHandler(
  type = 'set-style', function(message) {
    var controller = get_gio(message.id);
    controller.setStyle(message.style);
    controller.update(); // force update the visualisation
});
This forces the chart to update, applying the new style. Below we write an application that provides a dropdown to switch between two styles (Figure 17.5).
library(gio)
library(shiny)

# two phoney datasets
arcs <- data.frame(
  e = c("US", "CN", "RU"),
  i = c("CN", "RU", "US"),
  v = c(100, 120, 130)
)

ui <- fluidPage(
  selectInput(
    "style",
    "Select a style",
    choices = c("blueInk", "earlySpring")
  ),
  gioOutput("globe")
)

server <- function(input, output){
  output$globe <- renderGio({
    gio(arcs1, i, e , v)
  })

  observeEvent(input$style, {
    gio_proxy("globe") %>%
      gio_set_style(input$style)
  })

}
shinyApp(ui, server)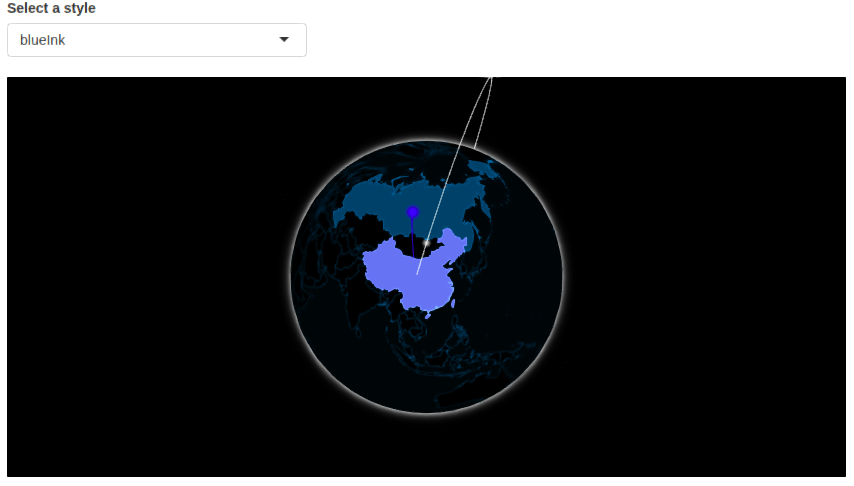
FIGURE 17.5: Gio with dynamic style