Chapter 10 Final Revisions
In this chapter, we polish the API that gio presents its users and provide guidelines to integrate other JavaScript libraries with R best.
10.1 Htmlwidgets and Data
The gio package built thus far revolves around the gio function, which expects a dataframe with three columns named e, i, and v, which is not great practice; there are ample reasons why very few functions do that.
First, it is unlikely that one comes across a dataset with such names in the real world thus users of the package will likely need to rename the columns of the dataset in order to use gio, making the package rather unwieldy. Second, this makes understanding and approaching the gio package more complicated; it will not be evident by looking at the examples, and usage of gio.
Instead gio should accept the dataframe as the first argument and then the relevant columns to extract. This can be implemented in many ways ranging from arguments that accept the column names as strings to reproducing ggplot2’s aes function. Here we settle for using non-standard evaluation to provide arguments that accept the bare name of the columns.
gio <- function(data, source, target, value, ...,
  width = NULL, height = NULL, elementId = NULL) {

  # defaults to NULL
  group <- NULL

  if (crosstalk::is.SharedData(data)) {
    group <- data$groupName()
    data <- data$origData()
  }

  data <- dplyr::select(
    data,
    i = {{ source }},
    e = {{ target }},
    v = {{ value }}
  )

  # forward options using x
  x = list(
    configs = list(...),
    data = data,
    style = "default",
    crosstalk = list(group = group)
  )

  attr(x, 'TOJSON_ARGS') <- list(dataframe = "rows")

  # create widget
  htmlwidgets::createWidget(
    name = 'gio',
    x,
    width = width,
    height = height,
    package = 'gio',
    elementId = elementId,
    sizingPolicy = htmlwidgets::sizingPolicy(
      padding = 0,
      browser.fill = TRUE,
      defaultWidth = "100%"
    ),
    preRenderHook = render_gio,
    dependencies = crosstalk::crosstalkLibs()
  )
}
The above changes allow documenting the input that gio accepts more clearly with roxygen2 and also makes its usage more transparent: it is now clear to users what data is required to create a visualisation, and they are free to use dataframes of their choice.
# mock up data
countries <- c("US", "BE", "FR", "DE")
df <- data.frame(
  from = countries,
  to = rev(countries),
  traded = runif(4)
)

# use gio
gio(df, source = from, target = to, value = traded)
This small change makes the package a great deal more comfortable to use and understand as source, and target are vastly more evident to understand than e and i.
10.2 Plethora of Options
Some JavaScript libraries can be extensive and come with thousands of options that can make the port to R rather bulky. Never hesitate to make use of the three dots construct (...) to make these accessible yet saving you from having to hard-code thousands of arguments.
For instance, gio.js accepts a JSON of options to customise the globe further. One could port all of these manually, or allow users to specify those configurations via the three-dot construct.
var configs = {
  control: {
    stats: false,
    disableUnmentioned: false,
    lightenMentioned: false,
    inOnly: false,
    outOnly: false,
    initCountry: "CN",
    halo: true
  },
  color: {
    surface: 0xFFFFFF,
    selected: null,
    in: 0x154492,
    out: 0xDD380C,
    halo: 0xFFFFFF,
    background: null
  },
  brightness: {
    ocean: 0.5,
    mentioned: 0.5,
    related: 0.5
  }
}

controller = new Gio.controller(el, configs);
The three dots can be added to the gio function, which internally captures them in a list named configs so it can be easily referenced in JavaScript.
# add ...three dots
gio <- function(data, source, target, value, ...,
  width = NULL, height = NULL, elementId = NULL) {

  # ... start of the function

  # forward options using x
  x = list(
    configs = list(...), # pass to configs
    data = data,
    style = "default",
    crosstalk = list(group = group)
  )

  # ... end of the function
}
In JavaScript, use the configs when initialising the visualisation.
Below those configuration options are now used to set the initially selected country to the United States and change the colour of the selected country to red in Figure 10.1.
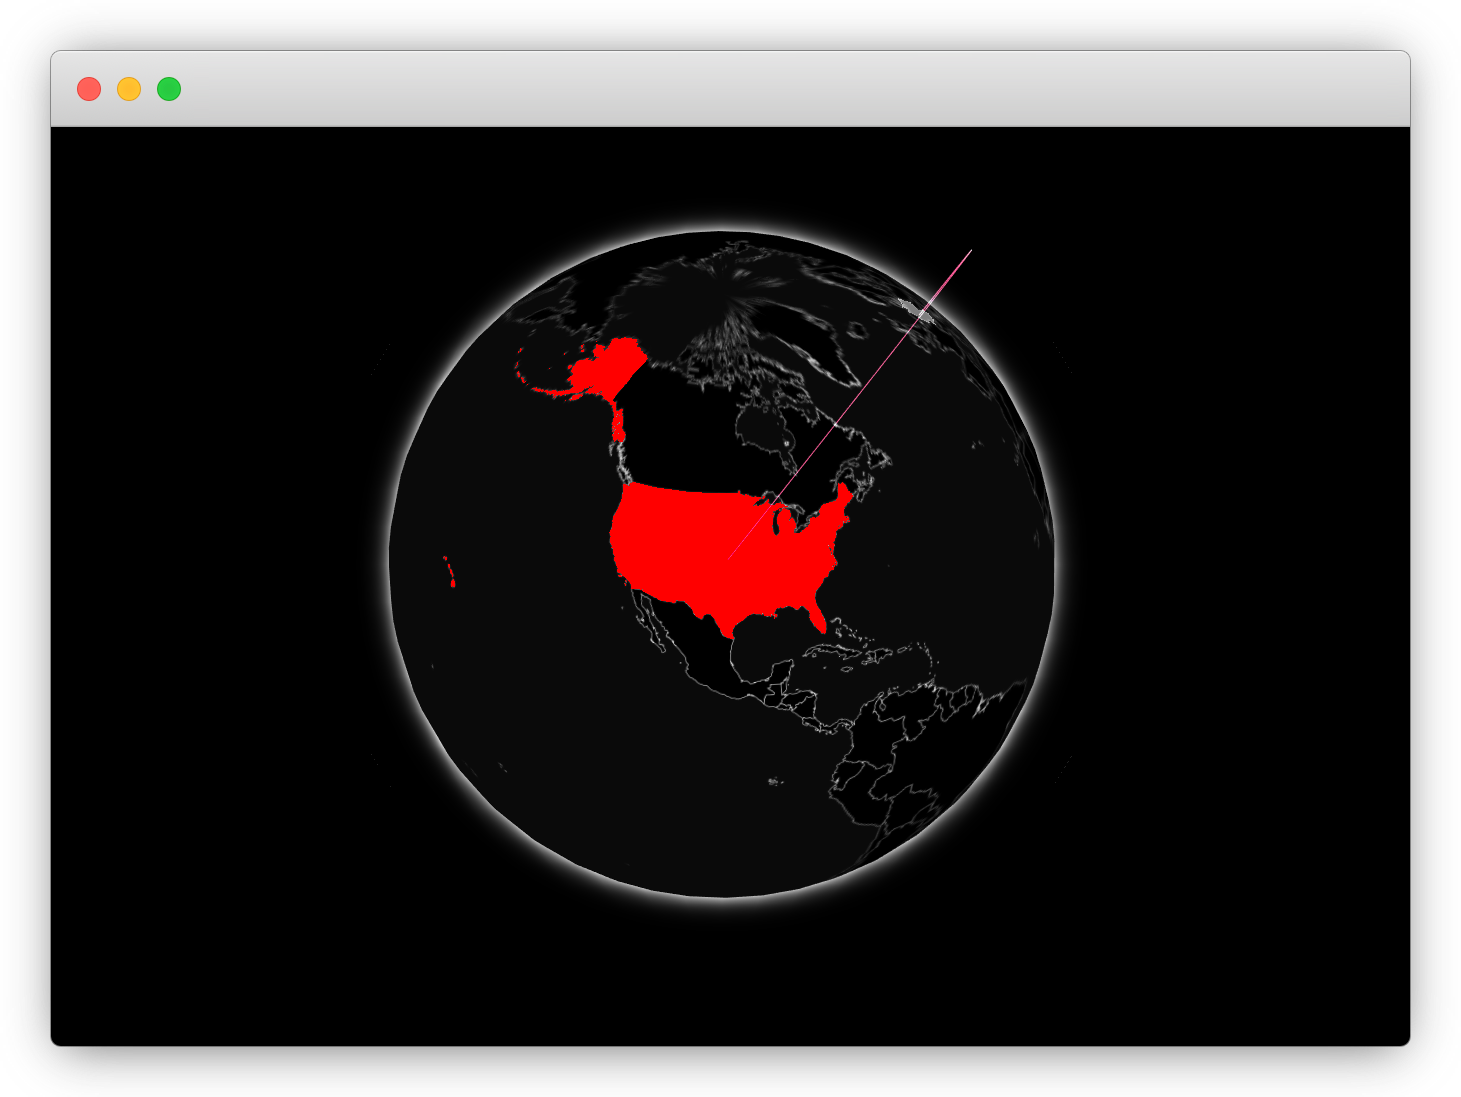
FIGURE 10.1: Gio and plenty of options
10.3 Interface Design
As you develop a wrapper to an external visualisation library, you will have to make design choices. In building gio, we more or less mirrored the JavaScript code one to one: where there is a JavaScript function to change the theme of the visualisation, there is one in R, etc. This might not scale appropriately as more and more functions are added to the package.
As observed, the gio.js library has a function named setStyle to change the theme of the visualisation, but it has numerous others, setSurfaceColor, addHalo, setHaloColor, removeHalo, and plenty more. We might want to wrap all or some of these in a single function to provide a more convenient API to the R user.
Design for humans: always keep in mind the interface you make available to users as you develop the package.
You can always go beyond what the underlying library provides. For instance, the country selected by default is always China, regardless of whether the data includes that country or not. This can lead to creating underwhelming visualisations as no arcs appear. One can consider adding simple heiristics to the gio function to ensure that is not the case, or have the function throw a warning when the initial country is not present in the dataset.
Finally, consider R users’ expectations. There are many prominent visualisation packages on CRAN already, users of the gio package will likely have used ggplot2 (Wickham, Chang, et al. 2020), plotly, or highcharter before. Though these provide somewhat different APIs, they set precedents. The more the API of gio resembles those, the easier it will be for new users to start using gio. However, do not let this restrict the package either. Never hesitate to do differently than ggplot2 if you think it will provide a better interface to your users.
10.4 Exercises
Widgets likely involve numerous concepts that are new to most readers. It is a good idea to try and work on a widget of your own to grasp the learnings of this part of the book entirely. A quick Google search for “JavaScript visualisation libraries” uncovers hundreds of candidate libraries that can be made accessible from R; below is but a small selection.
- chart.js - simple yet flexible JavaScript charting
- cytoscape.js - network theory library for visualisation and analysis
- Toast UI charts - easy way to draw various and essential charts
- amcharts - library for all your data visualization needs
References
Wickham, Hadley, Winston Chang, Lionel Henry, Thomas Lin Pedersen, Kohske Takahashi, Claus Wilke, Kara Woo, Hiroaki Yutani, and Dewey Dunnington. 2020. Ggplot2: Create Elegant Data Visualisations Using the Grammar of Graphics. https://CRAN.R-project.org/package=ggplot2.